By Vidnyan Sawant, AVP - technical research at GEPL Capital
On the monthly charts, the Nifty is sustaining above the breakout of Cup & Handle pattern at life high levels indicating strong positive undertone of the index. On the weekly charts, the stock has been consistently forming Higher Top Higher Bottom pattern since April 2023. However, in the previous week, the Nifty formed long upper wick candle indicating profit booking has happened at higher levels.
We witnessed the lower top lower bottom formation in the Nifty Index on the daily charts for the last few days indicating a short term corrective sign.
The momentum indicator RSI is declining from over bought level on the daily charts, indicating a loosing positive momentum of the Index for the short term. The index has a strong support at 19,562 (weekly low) followed by 19,230 (key support). While on the higher side, the mark of 19,991 (life high) followed by 20,200 (key resistance) are crucial levels to watch out for.
The overall trend of the Nifty index looks positive till it sustains above 19,562 levels and potential upside would be 19,991 followed by 20,200 mark, however if it breaches 19,562 level on the downside then it will correct till 19,230 mark for the short to medium term.
Here are three buy calls for next 2-3 weeks:
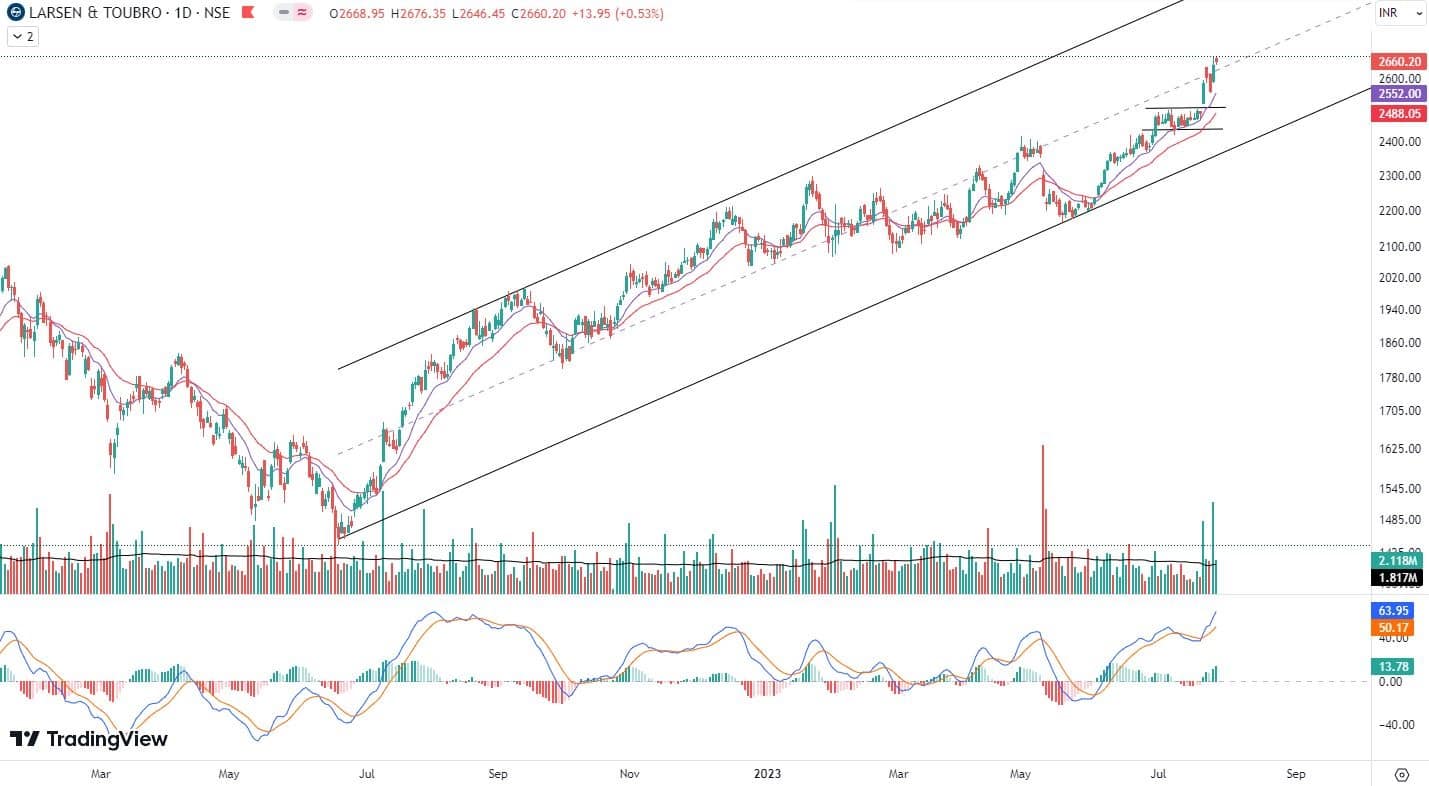
Larsen & Toubro: Buy | LTP: Rs 2,660 | Stop-Loss: Rs 2,550 | Target: Rs 2,900 | Return: 9 percent
The correction in the stock of L&T took place gracefully as the stock post December 2022 did not get into the formation of Lower Highs and Lower Lows despite the overall market correction. This illustrates the positive undertone of the prices.
Currently, the stock appears to be emerging from a consolidation phase, signaling a continuation of the uptrend. The breakout from this consolidation was accompanied by a Gap and substantial trading volumes, providing further confirmation of the breakout.
Moreover, the prices have consistently found support at the 12-day exponential moving average (EMA), which has acted as a reliable variable support level. This reinforces the notion of an upward trend beginning to take shape.
The momentum oscillator, MACD (moving average convergence divergence), has demonstrated a favourable crossover above the zero line, reflecting the likelihood of prices trending upward from their current levels.
Going forward, we can expect the stock prices to move higher till the level of Rs 2,900 where the stop-loss must be Rs 2,550 on the Daily Closing basis.
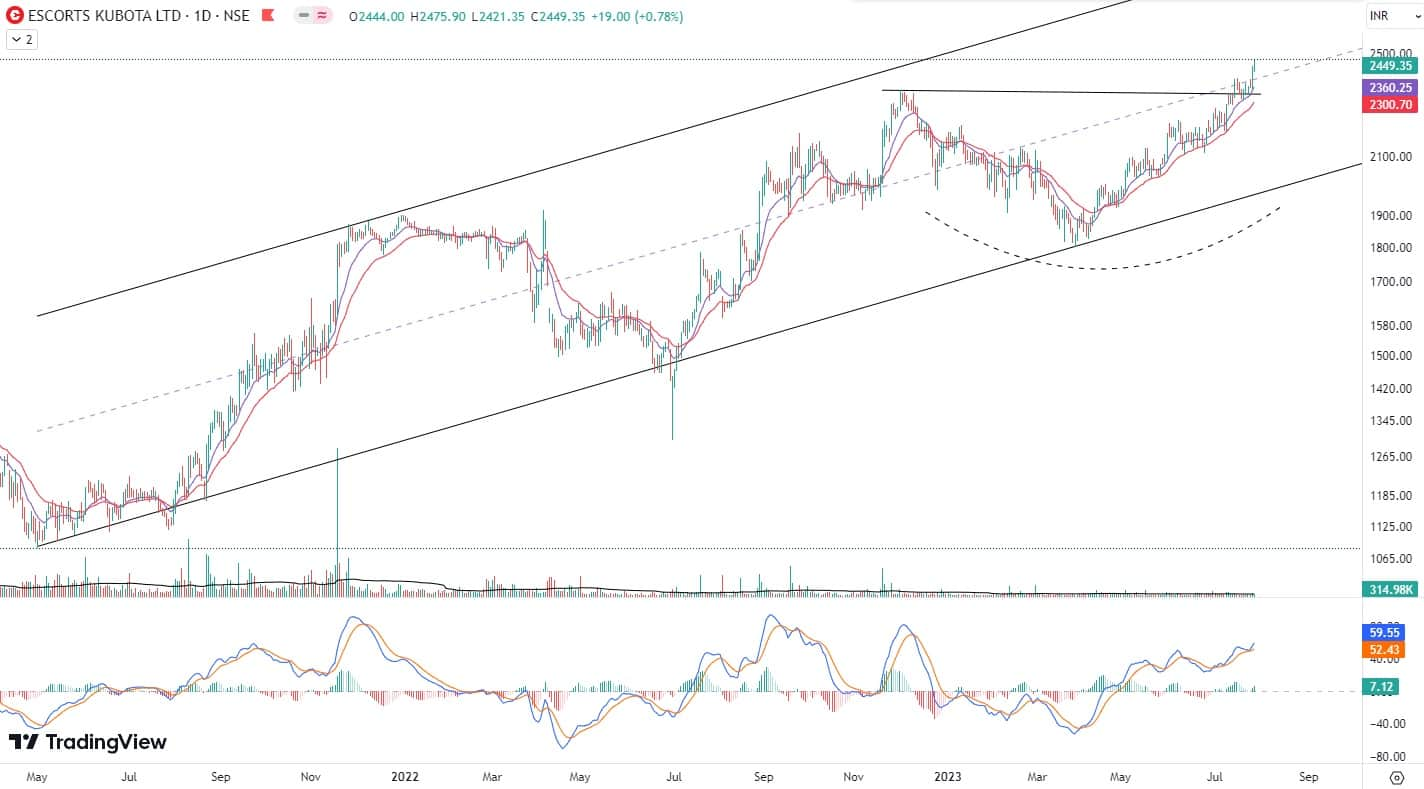
Escorts Kubota: Buy | LTP: Rs 2,449.35 | Stop-Loss: Rs 2,320 | Target: Rs 2,650 | Return: 8 percent
The stock is currently performing at an unprecedented level, with a clear upward trajectory marked by consistent increases in both highs and lows within the established rising channel.
Recently, a breakout from a Rounding Bottom pattern was noticed in the stock. This is an encouraging signal that suggests the continuation of the upward trend.
When it comes to support levels, the stock prices have been reliably cushioned by the 12 & 26-day exponential moving averages (EMA), reinforcing the upward trend during each phase of growth.
As for the momentum of the stock, the MACD indicator remains in a strong position well above the baseline, demonstrating the stock's sustained positive momentum.
Looking forward, we anticipate that the stock prices will continue to climb until they reach the level of Rs 2,650. At this point, a stop-loss should be implemented at Rs 2,320 on a closing basis.
Godrej Properties: Buy | LTP: Rs 1,707 | Stop-Loss: Rs 1,610 | Target: Rs 1,950 | Return: 14 percent
The stock formed CIP (change in polarity) formation near Rs 1,000 levels in March 2023 and bounced back with the formation of Higher Top Higher Bottom on the monthly charts indicating strong positive undertone for the long term trend.
On the weekly charts, the stock has given a Cup & Handle pattern breakout with volume confirmation which confirms the bullish structure of the stock. On the daily charts, the stock has been consistently moving upward with the support of 13-day EMA and sustaining at 52-week high level.
Also the stock is sustaining above its important moving averages like 50, 100 & 200-day SMA (simple moving average) which shows the strong bullish sentiments of the stock.
The momentum indicator RSI (relative strength index) on the weekly as well as on the daily timeframe is rising and sustaining above 65 levels reflecting presence of positive momentum.
We expect the prices to move higher till Rs 1,950 level where the stop-loss must be Rs 1,610 strictly on the closing basis.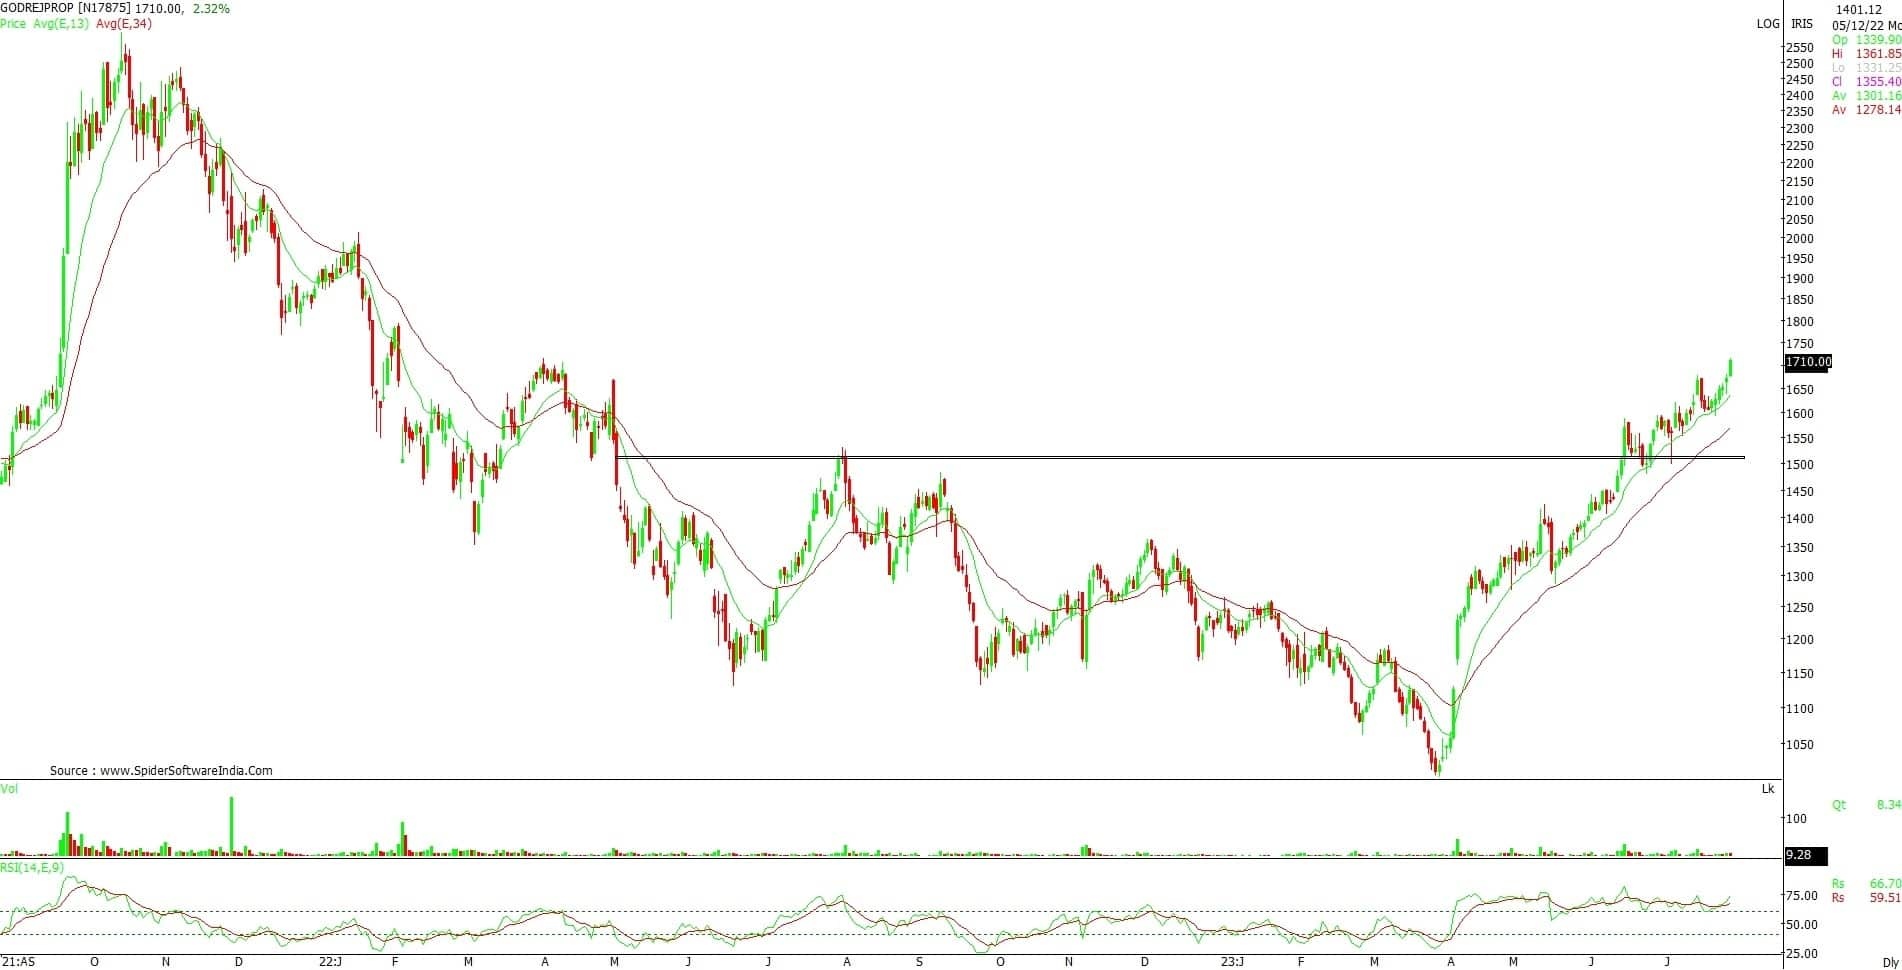
Disclaimer: The views and investment tips expressed by investment experts on Moneycontrol.com are their own and not those of the website or its management. Moneycontrol.com advises users to check with certified experts before taking any investment decisions.

Discover the latest business news, Sensex, and Nifty updates. Obtain Personal Finance insights, tax queries, and expert opinions on Moneycontrol or download the Moneycontrol App to stay updated!